"Gamers" and Biases

In baseball, "gamers" are quite the peculiar phenomenon. If you aren't familiar with the term in its baseball sense, perhaps it will help to think of it in terms of a more accessible definition of the word. Gamers are people who play video games, technologically-inclined contestants who plug into a virtual world of gameplay rather than dust off the old chessboard or backgammon set or whatever board game of choice; in other words, they exemplify the anti-Milton Bradley in gameplay. Same thing in baseball.

But perhaps you're still confused. It's tough to know, say, a gamer from a dirtball from a jerk. Don't worry. Bert Blyleven's got you covered. As it turns out, Blyleven enlightens, a gamer and a dirtball are, in fact, the same thing. They are players who are tough and gritty, who work hard and help their teams win. That seems clear enough. If a guy works hard all the time and helps his team win, he's a gamer, right?

Not so fast, Blyleven says. A guy can work hard and be a great player, but if he's a jerk, why, that's no gamer. Kirk Gibson? Not a gamer. Tough as nails? Check. Great player? Check. Did everything to help his team win? Check. Has enough of a positive influence on players that teams have employed him as a Major League coach for the better part of the last decade? Check. So what's wrong with Kirk Gibson? I'll tell you what: the jerk store called, and they're running out of Kirk Gibson. And he probably slept with your wife.

How about Tim Foli? We are given the perfect anecdote to determine whether the man was a gamer:

(Foli) was a hardnosed shortstop who had an attitude and a fight about him, and was not afraid to say what was on his mind. In fact, I remember an incident where he questioned the tactics of manager Chuck Tanner, and they had an altercation that escalated to the point where Tanner’s hands were around Foley’s (sic) throat.


If you could only give one anecdote to explain why someone is or isn't a gamer, what better one than this? Why, it's such a good example that if you played with hundreds of teammates over a 22 year career and had to select the three biggest gamers you ever played with, this is the kind of thing that vaults you to that level.

So a gamer can question authority, undermine the manager, speak up disruptively, and get into physical altercations with the skipper (and presumably teammates as well).

Compare this description of Foli to another player: Dick Allen. Allen was known for having an attitude and a fight about him, and he was allegedly not afraid to say what was on his mind. He even once got into a fight with teammate Frank Thomas because of this spirit. Pretty much everything that qualifies Foli as such a gamer. Yet Allen was widely viewed as a disruptive force for those same traits and for his altercation with a teammate (which amounted to Thomas hitting Allen with a bat, not Allen being the aggressor). Craig Wright wrote an excellent piece for SABR (PDF file) defending Allen which covers many of the misperceptions regarding Allen, including those stemming from the fight, which lists the following details picked up from interviews with Allen's coaches and teammates:

-the fight happened because Allen was defending a young black player from demeaning remarks from Thomas
-Thomas was unpopular on the team and Allen's teammates generally supported Allen in the altercation
-The manager was looking for a reason to get rid of Thomas anyway and the team released Thomas following the altercation (which also meant when the team was forbidden to speak to the press about the fight, Thomas gave his own account uncontested after being released that painted Allen as the bad guy)
-Coaches and teammates said the fight had no effect on the team's morale

So if getting in a fight with the manager with no specified reason can actually make someone a gamer, sticking up for a teammate against the abuse of an unpopular and disruptive veteran should certainly qualify Dick Allen. This is an interesting dichotomy: in most players, the traits and incident Blyleven describes in Foli are viewed as undesirable and disruptive, but when you get a different idea of a player in mind, those things somehow come across as endearing.

This pattern continues in Blyleven's gamer descriptions. For Ed Ott and Pete Rose, the examples given that exemplify their gamer-ness are examples of them needlessly injuring players. For Ott, the anecdote is, "During one incident after he broke up a double-play at second base, he body-slammed Mets infielder Felix Millan so hard he broke his collar bone." I cannot think of a way to cleanly break up a double play by body-slamming someone so hard it breaks his collarbone (though maybe that is just a communication issue as far as what constitutes "body-slamming" to me and to Blyleven), or how that is any more playing hard and helping the team win than just breaking up the double play without doing it in a dirty and dangerous way.

Michael Young is cited as a gamer for the fact that he has changed positions twice: once to shortstop when Texas acquired a worse defensive middle infield starter (Soriano), which is a move I'd imagine most middle infielders would be thrilled with, and once to third when Texas got a real shortstop (Andrus), which prompted anything-for-the-team gamer Young to
request a trade rather than willingly switch positions for a clearly superior fielder. Compare that to the second baseman who first moved him, Soriano. His displeasure with his move to left field was widely publicized and derided. Young's is ignored. Both players initially refused to accept the switch their teams asked of them, and both ended up switching anyway because they realized the manager fills out a lineup card and wherever you are, you play there with no recourse to play where you want instead. No one calls Soriano a gamer for making that kind of position switch. What is different about Young? For that matter, when A-Rod joined the Yankees and was widely regarded as the superior shortstop, why was it non-gamer A-Rod and not gamer Derek Jeter who volunteered to switch positions?

Most of the reasons given for a player being a gamer are just terribly generic and nondescript. They feel as if you could replace the name in the heading with any of dozens of other names and not notice. Nick Punto is a gamer because he plays hard and plays good defense and can't hit but still manages to occasionally not end up with the worst possible outcome at the plate. Eric Chavez makes the list because he used to be good and has had injury troubles and now doesn't want to retire, and because dammit, he plays the hardest damn DH you've ever seen. Dustin Pedroia is a gamer because he looks like a midget logger. And he plays hard.

Not that things like playing hard and going all out aren't great traits to have, but really, that describes the majority of players who are in the Majors, and probably in the minors too. Trying to distinguish a handful of players by how hard they play is probably pointless. Just about anybody with marginal or below-average Major League skills (which is a lot of players) is going to be putting everything he has into the game every time he plays in order to be where he is, and most players who are better than that probably are doing the same. You aren't going to be able to find a short list of players out of the several hundred in MLB who legitimately distinguish themselves from everyone else in that regard. So when you resign yourself to the task of selecting just a few players for praise for this aspect of their game, there is a ton of potential for bias in which players you select. Why choose player A who plays hard and does the little things to help is team win over player B who does the same things? Or, as it may be, why choose player C who undermines the manager's authority and picks fights and is contentious, or player D who plays catcher for the White Sox and is keeping the jerk store going through the Kirk Gibson shortage by being their number one seller?

Maybe player A looks small and scrappy and his skills are less obvious from an athletic tools standpoint. Maybe he looks like someone you might see at your office or in your neighborhood at at your kid's ballgames watching his kid. Maybe he has a certain reputation in the media or among fans. Maybe it is some other bias.

Consider Latin American players. Consider the economic status many of them come from, or a scenario where developing under skilled and devoted coaching means sticking out of a large crowd of other kids enough to catch the eye of the buscones and hopefully get a look from some pro teams, where making the Majors means distinguishing yourself from your early- to mid-teens as a pro prospect, distinguishing yourself in camps and workouts with countless other prospects, and distinguishing yourself in summer and winter ball in Latin leagues just to break into the low minors, and then distinguishing yourself from there where most American players are entering into the system directly. Consider how hard most of those players have to work to take that route, and then think that not a single one of those players plays hard enough or does enough little effort things to help his team to distinguish himself among the game's great gamers. That is a ridiculous notion. Of course there are players from Latin America who have spent their lives putting everything into every play as much as anyone in the game does. When no such player is lauded as a gamer, it is not because of a lack of traits or effort or whatever it is that distinguishes one as a gamer.

This isn't to say that there is something wrong with trying to give credit to players you really like or trying to highlight the things you like about that. The issue is, when you do undertake such a subjective task, and when you set out to whittle down hundreds of candidates who could all fit the description just as well to a small handful, biases are going to creep into your selections, be they personal biases or cultural biases or whatever. Because of the nature of a list like this, biases will more than creep in. They can end up dominating your list. Maybe that is ok-maybe I want to highlight how hard Albert Pujols works and how good an example he sets and how he does all the things I would want in a player because I am a huge Pujols fan and it is not that important to me that I don't know how hard everyone else is also working or how much of the same effort they are also putting in. And maybe staring down home runs or glaring at umpires is confidence and intensity and an expression of dominance when Albert does it and showboating or upstaging when someone I don't like does it, and I can be biased because those are my feelings and I understand that. Or maybe it's not. I think that's an important question to ask with this type of thing. What biases are influencing your choices? Are you ok with exhibiting those biases? Are you ok not just with who you are choosing to single out for praise but with who you are leaving out and implicitly setting aside as below your chosen group? Does your opinion, with the biases, add anything to our understanding of the issue being discussed, or is it just applying a generic standard to your personal favourites? Are you doing genuine research or just listing off things off the top of your head that anyone could have done (which is not only not insightful, but also particularly prone to biases that you likely won't identify)?

That means when you single out Tom Foli for his desirable trait of having a fighting attitude and spirit, even when it puts him at odds with the manager or leads to altercations within the team, does that mean you are also ready to single out and praise Dick Allen for the same things (or perhaps Carlos Zambrano, or whoever else)? If not, either you are not communicating your reasoning very clearly, or you are communicating a biased viewpoint. Can you call A-Rod a great gamer for willfully switching positions and for hitting further down in the batting order when the manager put him there and he had no choice? Certainly the man plays hard and has trememdous demands for himself when he plays. Or is there something else that you need to communicate that sets your choices apart? If you are ok with these extensions of your reasoning, what led you to single out the players you did over others who exhibit the same traits listed?

I don't mean to just single out Blyleven here. I use his article because I think it is a good example of something that we are all prone to, and I think looking at his article introduces a lot of questions that I think need to be answered when writing a piece like this.

And, for the hell of it, I close with a gamer-mosaic:


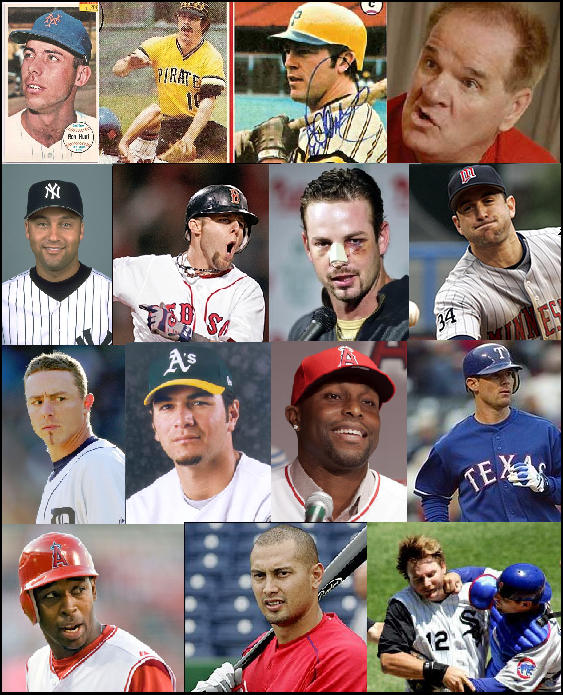
By the way, notice any biases there?
Continue Reading...

Opening Day

As I am about to take my son to another opening day, I pause to reflect on some amazing opening day experiences and memories I have accumulated over the years. This is not a comprehensive list, but an odd assortment of experiences that every true fan will enjoy. I hope they facilitate a whole fountain of precious memories for you, as well.

After seeing the Cards play on grass every year of my life, I was there opening day in 1996 when the major renovations took place to the interior of Busch, including the installation of grass, the red seats, the manual outfield scoreboard, and the flags in right center field for all those whose numbers had been retired.

I remember 1980 opening day, when I scored some tickets in the front row - directly behind the Pittsburgh bullpen. Rod Scurry was a relief pitcher for the Pirates, and his hands were massive. I have no idea why, of all things, I remember that, but seeing those pitchforks at the end of his arms stuck in my mind. By the way, Pete Vuchovitch pitched a brilliant three-hit, complete-game shutout to beat the Pirates 1-0 - the only run scoring when George Hendrick doubled home Bobby Bonds from first in the second inning. How many opening day starters will throw a complete game this year?

In 1983, I was there to see the Cards get their World Series rings. The year before, I camped out three different nights in order to get tickets for both League championship games against the Braves, and for three of the four World Series games against the Brewers (how I missed game 7 tickets is a long and painful story for another time).

In 1995, I took my boys out of school (a fairly common, if not annual, ritual) to attend another opening day, this time in Kansas City. The season got started late because of the player strike that cancelled the World Series (I actually say the last game played in ’94 - when the Cubs lost to the Giants and I was in the bleachers at Wrigley). So, the players’ strike ended, but the Umpire strike had just begun. When we showed up at the Stadium around 9am, there was Bruce Froemming and about six other umpires walking around the parking lot and making a lot of noise. I was a college and high school umpire, so I thought this was amazing. I spent the morning talking with them and supporting their cause. Twice, reps from the KC front offices were sent out to ask them to leave, and I was one of about a half dozen fans that told those front office people to back off. All of a sudden, Bruce and the other umps did a dead sprint across the parking lot (well, by dead sprint I guess I mean the kind of sprint that someone like Froemming does that threatens their death - he did carry a lot of weight with him), yelling obscenities. I thought, “What the hell?” A cab had just pulled up, and the scab crew had gotten out and was walking into the front doors when the umps caught sight of them and gave them hell. It wasn’t long after this that the front office people came out again and threatened to bring the cops out to escort them off the parking lot. Bruce and his clan were thinking about packing it in, when I went up to them with what I thought was a brilliant idea. The Royals were trying to win fans back after the strike cancelled the World Series, and they were giving away General Admission seats on a first come, first served basis. I told Froemming and his crew to get in line for free tickets, let the franchise that was trying to kick them out actually pay for their entry into the game, and then cause a ruckus while in there. Bruce looked at his colleagues and the started thinking about it. Shortly after that my sons and I went in, and I guess I just forgot about the umps. Until about half-way through the game. I heard some unrest kick up in the right field G.A. seats. When I looked to see what was going on, by golly there were the umps lined up and down the stairs in the right field corner, shouting something or other. It didn’t take long for the Royals to boot them out of the stadium- but they made their point. When I got home that night and watched SportsCenter, sure enough there they were. The story made National sports news.

All these are good stories, but the best ever opening day experience of all time is now to be told. In 2005, I attended the last ever game in the Old Busch Stadium. Through the winter, my son and I would attend the ground-breaking ceremony for the new stadium. I would show up at odd hours to watch the demolition of the old, and stood there on a freezing cold night when at about 1:00am the last arch went down. There were a few tears shed. I broke through security fences a number of times to steal odd pieces of the deconstructed stadium, and bough at auction some bleacher seats (where I spent much of my childhood - left field, of course, watching Lou Brock), some red seats, and the large white St. Louis flag that flew at the top of the Stadium.
When opening day rolled around, every effort my brother and I had made to get tickets proved fruitless. We showed up early that morning in 2006 with pockets full of money ready to buy a ticket for whatever it cost. There was nothing. We attended all the opening day ceremonies outside the stadium; met the project director for the stadium construction (hold that thought - we’ll come back to it); and with only hours left before the first pitch still had no tickets. My brother finally answered a call from a childhood friend of his who was on the paint crew of the new stadium, and who was actually in the stadium just hours before the first pitch finishing the painting. He said he didn’t know what use they would be for us, but he scored us two visitor’s passes. He came outside and handed them to us.
What’s a visitor’s pass? We had no idea - we still don’t. But once we had them, our thinking was this: walk through every door you can until someone says “What the hell are you doing here?!” So, when we saw some press people walking through a glass door about three hours before the game, we thought - “What the heck, let’s try it.” We went up to the security guard, flashed our cardboard visitor’s passes, and were prepared for anything but what we heard - nothing. Just a quick nod of the head and we were through.


Our first trip was to the Cardinal dugout - in which we sat for a few minutes before we walked down the line into the outfield. The Stadium was empty - gates wouldn’t open for another hour. When we saw the Cardinal pitcher’s emerge out of the dugout and begin some warm-up tosses, we thought we were in trouble. Turns out not. They were surprised to see us, but as we would learn as the day wore on as long as we pretended like we belonged, no one would question it. We talked to Jason Isringhausen and Adam Wainright, whom I saw pitch five years earlier when he was an 18 year old starting out his career with the Macon Braves.
We walked through every corridor in the Stadium. We saw very little of the game, telling ourselves that this day was about the Stadium. We stood next to Jack Buck’s widow as she lofted the flag up the new flagpole in the Center field plaza right before the playing of the national anthem. We were behind the outfield wall as the Cardinals mounted the red Mustangs that would take them onto the field for their inaugural introduction to the fans - an Opening Day tradition in St. Louis. At one point, we saw a set of stairs go up a wall that led to a door. We climbed it, opened the door, and were in the Cardinal bullpen. You heard that right - in the bullpen. We thought we were in real trouble. Relief pitcher Brad Thompson was standing right there, looked over at two fans now in his bullpen, and said “Who are you?!” I was scared crazy, but not my brother. Jimbo has never met a stranger before, and he just stuck out his hand, said, “Hi, I’m Jim Dorhauer and this is my brother John.” Brad shook our hands, and we just stood there with Brad until the inning ended, exchanging some small talk and well-wishes, admiring the new digs. Then we left. I was half-way down the stairs when I heard the door open again. Jimbo wanted something else. I turned just in time to hear him shout, “Hey, Brad, throw me a ball.” By golly, he did just that and Jimbo walked away with a prize.
From there, we continued opening every door except one: when we got to the player locker room we just stood for a minute or two in awe and wonder and out of respect (not fear, mind you - we had gotten long past that), we refused to break the sanctuary that is the player’s locker room.
I found my good friend’s seats and sat with him for a while and told him what we had been doing. He was jealous and amazed, and refused to believe that we actually made it into the bullpen. So, guess what? We went back and took him with us. When we opened the door and he caught a glimpse of the field from there, he was awestruck. He would not go into the bullpen, but he did stick his foot over the threshold just so he could say he was there, and then ducked back down the stairs and went back to his seat with his own story to tell.
From there we went to the luxury boxes. We met Bob Gibson outside one, and Jimbo got pissed when Bob wouldn’t sign the ball for him. We ended up the owner’s suite - which is located near a whole slew of cooking stations with chefs ready to cook to order whatever cuisine you wanted. There were only a few outs left in the game, and I actually sat in a seat for the first time. Jimbo stood behind me, and before too long I heard him talking to someone. I wasn’t interested in that conversation until I heard him ask: “Are you guys pissed that Selig didn’t show up for this today? I mean, its his Brewers you guys are playing?” The guy admitted they were a little miffed. I wondered who the hell this was, and turned around: it was the Stadium project manager we saw outside the Stadium earlier in the morning - long before we had tickets.
The game ended, and it dawned on both of us we still didn’t have tickets. We wanted those to keep for memories’ sake - and so we started bidding on tix to buy of those who actually paid to see this game. We found a couple of drunks who thought the $40 Jimbo was offering sounded good, and one whom I found who actually gave his away for $20 (I watched Jimbo bid for his and realized if I found someone who was drunk, I could probably get mine cheaper). Thus ended the perfect opening day.
Continue Reading...

More Esoteric Ramblings About ERA+

Recently, Baseball-Reference briefly unveiled a new version of ERA+ which rescaled the stat to show how a pitcher's ERA related to the league rather than how the league related to the pitcher's ERA. With the old numbers, 200 meant that the league ERA was 100% higher than the pitcher's ERA; with the new figures, that 200 is instead presented as 150, meaning that the pitcher's ERA was 50% lower than the league ERA. The advantages of the new version, as well as some of the limitations, were discussed recently by Patriot on his blog.

This new version was soon rolled back, as B-R announced that the change was premature and that the official change will require a more organized approach (apparently simply switching important numbers around unannounced with no explanation and waiting to see if anyone notices is confusing, or something like that). However, in the ensuing discussion of the new version in the afore-linked B-R blog post, poster PhilM brought up an interesting point.

This post is not about anything specific to the new version of ERA+ or to the switch at B-R (should I have mentioned this somewhere in the 2-paragraph lead-in? Well, I'm telling you now, anyway), but before I begin (begin? Should I have also done that before the third paragraph?), let me explain one key benefit of the new version of ERA+. Under the old version of the stat, 2 pitchers with ERA+'s of 200 and 100 over the same number of innings would have a combined ERA+ of...133. Strange, huh? Two 150 ERA+ pitchers were better than a 200 and a 100 ERA+ pitcher, because to combine ERA+, you had to take the harmonic mean, not the simple average. Convert those to the new version, and the 200/100 pair of pitchers have ERA+'s of 150 and 100, for a combined 125 (hey, that's what we'd expect!). The 150/150 pair under the old ERA+ would each have an ERA+ of 133 using the new version. With the new ERA+, it's obvious how to combine ERA+, and it's easy to see that two 133 pitchers are better than a 150 pitcher and a 100 pitcher combined. For the rest of this article, I'll refer only to the new version, so when you see ERA+ after this, think of the version where 150/100 average to 125.

Now, back to PhilM (remember PhilM?): PhilM noticed that when he calculated Walter Johnson's career ERA+ by taking the average of each season ERA+ weighted by IP, it was not exactly the same as his actual career ERA+, although it was close (133 vs. 132). This is an important observation. ERA+ represents the percentage of the average number of earned runs a pitcher allows over a given number of innings. A 150 pitcher allows 50% fewer ER than average. A 133 pitcher allows 33% fewer ER than average. A 90 pitcher allows 10% more ER. You arrive at this percentage by dividing the pitcher's ER by the amount of ER a league average pitcher would have allowed (which you figure by prorating the league ERA to the pitcher's IP). A pitcher who allows 50 ER when the league average pitcher would have allowed 100 allows 50% fewer ER than average, so he has a 150 ERA+.

What this means is that if you want to combine ERA+, what you are really doing is figuring the combined ER allowed, and the combined league average ER allowed; in other words, when each individual ERA+ represents the fraction ER/lgER, you are adding the numerators of each fraction and adding the denominators of each fraction (not adding the fractions themselves; you don't care about common denominators or anything of the like-you may let out a collective sigh of relief here if you feel so moved). If your individual ERA+'s represent the following fractions:

50/100, 20/30, 70/60, 100/100

Then the combined ERA+ will be:

(50+20+70+100)/(100+30+60+100)

Simple enough, right? Now, what PhilM noticed was that this calculation for combined ERA+ is not the same as weighting each individual ERA+ by IP and then averaging them, even though that is supposed to be how we combine ERA+. What gives?

The issue is that averaging the individual ERA+'s, weighted by IP, does in fact simplify to the sum of ER allowed divided by the sum of league ER allowed, but only if the league ERA is the same in each ERA+ you are combining. If that is not the case (and it usually isn't), then what you are doing when you average multiple ERA+'s is not calculating the combined ERA+ but estimating it (albeit pretty well).

This brings us at last to the actual point of this post. PhilM then asked the all-important question: if averaging each season ERA+, weighted by IP, is not the same as calculating career ERA+ directly, which is the better method? PhilM, being the smart guy that he is (I don't really know if PhilM is a smart guy; I assume he is smart because he asked such a good question, and I assume he is a guy because PhilM is a fairly masculine handle), noted that if you have two seasons, one with an ERA+ of 150 and one with an ERA+ of 100, and each had the same number of innings pitched, the intuitive thing would be to say that the pitcher was 125 overall, but in fact, whichever season has the higher league ERA will get more weight. PhilM showed that if the league ERA was twice as high in 150 ERA+ season, that the combined ERA+ would actually be 133, much higher than the 125 we would expect. What's more, if you switched the two seasons so that the league ERA is twice as high in the 100 ERA+ season, the combined ERA+ will be only 117. Of course, the league ERA isn't going to double or halve from year to year, but it will change, and that means that it will make a difference, even if that difference is usually small. Sometimes, such as when a pitcher goes from, say, San Diego to Texas and puts up very different ERA+'s for each team, it might make a pretty noticeable difference. PhilM even noted that the difference, even when small, could actually change the career leaderboard for ERA+, such as flipping Walter Johnson and Lefty Grove.

Let's examine this a little more closely to see what is going on. In PhilM's example, we have a 150 ERA+ season and a 100 ERA+ season, each with the same number of innings. If the league ERA in the former season is double that in the latter, then the combined ERA+ will be 133. That means if we want to combine the two ERA+'s, we can't simply weight by IP and average them. How, then, can we get combined ERA+ from each individual season?

To actually calculate the combined ERA+ by averaging each individual ERA+, you would have to weight each individual ERA+ not just by IP, but by the quantity IP * lgERA. As you can see, seasons where the league ERA is higher than average will get more weight in the calculation, and seasons where the league ERA is lower than average will get less weight.

Think, for a moment, about what ERA+ actually is. At it's core, it is a measure of ERA that removes the context of the run-environment. A 2.00 ERA in an environment where 3.00 is average is not the same as a 2.00 ERA in an environment where 4.00 is average- it's more like a 2.67 ERA in the 4.00 environment. The whole point is that a 133 ERA+ is equal to a 133 ERA+ no matter what the run environment is-whether it is a high- or a low-scoring environment doesn't matter. But, as we just saw, it does matter when we combine ERA+. Higher scoring environments get more weight in the combined figure when it is calculated in the traditional way. That goes against the general purpose of ERA+ of removing the effects of the run-environment on how we interpret the numbers. PhilM's proposal of using the weighted average of each season for career ERA+ fixes this issue and gives each season equal weight (by IP, of course) regardless of what the league ERA was in each season.

Given that the current method of calculating career ERA+ weights each season by a combination of IP and of the league ERA that season, I can definitely get behind this change. It's not entirely a clear-cut choice, though. The change would give different definitions of ERA+ for season and career levels, and the two would no longer be calculated in the same way. There is also the problem that each season is actually a combination of games much like a career is a combination of seasons. That means that over the course of a season, games in a higher run-environment get more weight in calculating season ERA+. In fact, this is probably actually a larger issue because, in general, run-environments will very much more from game to game than from season to season. Does that mean we want to calculate season ERA+ as a weighted average of each game ERA+? That would be a mess to calculate, and even then, you can still break up a game further into innings or PAs. At some point, you have to actually calculate ERA+ in the traditional way and accept the shortcomings, or else you have no pieces to average together to get ERA+ at the higher levels. Choosing where to make this distinction between calculating ERA+ directly and where to start calculating it as a weighted average of individual parts is problematic. Ideally, you make the distinction at as low a level as possible (doing it by game would be better than doing it by season, and doing it by season would be better than not doing it at all if you want to get as close to weighting every IP equally as possible), but each level you go lower makes the stat more of a mess to calculate. Making the distinction at the season level as per PhilM's suggestion is probably as far as you can reasonably go.

Furthermore, the method you use will depend on what precisely you want to convey. If you want ERA+ to just represent the percentage of runs allowed relative to the league average, then higher run environments actually do have more impact. If you want to present ERA as a run-environment neutral stat, or you want it to model value or wins rather than just runs relative to average, taking the weighted average is probably better. I think the way ERA+ is generally defined and explained (as percentage of league average in terms only of runs) follows the traditional method more closely, but the way it is generally viewed or interpreted or used (as a run-environment neutral perspective of pitcher value as measured by ERA) is more in line with the weighted average method. Like PhilM, I would at least ask Baseball-Reference to consider this change, but I would also understand if, after considering both methods, they elected to keep doing as they are.


*note-when I call this version "new", I mean new to Baseball-Reference, which publishes ERA+. The method was proposed some time ago by regular Book Blog poster Guy and has been used for tRA+ at StatCorner for a while.
Continue Reading...

The Role of Chance in Baseball

Lights flash throughout the stadium. The noise of the crowd is constant, rising with the excitement, but never dipping below the steady din of the conversations of 40,000 fans. It's a scene that would make Donald Trump proud. The pitcher sets himself in the cold October night. He delivers, and the ball turns end over end, hurling toward the plate, tipping and rolling, as the 40,000 sit on edge waiting to see where the dice stop: the crack of wood is a seven, the snap of leather a two. Yes, this is playoff baseball-a wondrous game, an enthralling spectacle, a beautifully wrapped crap shoot, a pair of dice cloaked in the charms of our modern rounders.

You know the story by now. Even if you never read Moneyball, you've no doubt heard Billy Beane's famous quote about the nature of the playoffs. In a game where even the Royals can expect to beat the Yankees 3 out of 10 times (even if they never pitched Zack Greinke), it's fairly obvious how much chance can enter into the outcome of a short series. Never has this been more obvious than in 2006, when the St. Louis Cardinals established themselves as an 83 win team over the course of 161 games, and then proceeded to out-roll the more potent Padres, Mets, and Tigers in one quick crap shoot after another, riding hot rollers Jeff Suppan, et al to a World Series title.

At least that's the story you tend to hear, even from the typically savvy among us. An 83 win team cannot really be better than a 97 or a 95 win team, but, of course, when you set them at the craps table and call out, "First to four!", anything can happen. It is, of course, true that there is a lot of chance involved in the outcome of a 5- or 7-game series. The inferior team will win a pretty significant portion of the time. What is missing from this story, however, is that the 162 game season is subject to the same laws of chance. Setting n=162 rather than n=7 certainly seems like a good way to cut out the noise and establish the true talent levels of each team, but the reality is that in baseball, where even the best and the worst teams fall within the .400 to .600 range, there's still a lot of chance involved.

Let's look at the 2006 Cardinals as an example. Let's assume, just for example's sake, that the Cardinals' .516 win percentage established their actual ability, and that each team they played was as good as its 162 game record. To win the World Series, the Cardinals had to go through a 5-game set with the 88-win Padres, a 7-game set with the 97-win Mets, and a 7-game set with the 95-win Tigers. While each series on it's own might give the Cardinals a decent chance for success, they had to win all three in succession. What are their odds of getting all the way through?

To keep the math simple, we'll ignore homefield advantage and individual pitcher match-ups and just assume that each team's probability of winning each game is the same. Against the .543 Padres, the .516 Cardinals would have a .472 chance of winning each game (using the log5 method), which would mean they have a .448 chance of winning the 5-game series. That's pretty good. Now on to the Mets.

This was a taller order. Not only did the Mets win 9 more games than the Padres, they had 2 extra games to let the better team work its way to the top. Here, the Cards would have just a .416 shot at each game and a .322 shot at the series. Against the similarly strong 95-win Tigers in the Series, the Cardinals had a .347 chance at winning the set.

The combined chance of all of these events happening together is just .050. If you bump up the Tigers a few wins for their tougher AL schedule, it's just .045. That's a mere 5% chance of the Cardinals winning the World Series if you assume that each team's regular season record establishes its true strength. In other words, if that assumption is true, then the Cardinals winning the World Series is a very unlikely outcome-hardly the type of thing you would expect to be described as a crap shoot.

Regular season records don't establish a team's true strength, however. There are, of course, issues of changing personnel, such as teams having health problems throughout the year and getting healthy for the playoff run (as the Cardinals did), but that's not what I'm talking about. Just the pure random chance that goes into a team's 162-game record can't be ignored any more than the chance that goes into a playoff series can. Recall that the chances of an 83-win team beating an 88-win team, a 97-win team, and then a 95-win team in the playoffs is just 5%. What kind of variability in a team's regular season record would cover that same likelihood?

The Cardinals won 83 out of 161 games. We want to know how good a team could be to still have a 5% chance of winning only 83 out of 161 games. That would be a .583 team, or a 94.4 win team. A team whose actual ability was .583 would be expected to win no more than 83 of 161 games roughly 5% of the time.

So when you think about the role of chance in the playoffs and that the winner of the series does not necessarily determine the better team, don't forget that the same caveat covers the regular season as well. When you see something like the 83-win Cardinals winning the World Series, the role of chance in the outcome of events could mean that the Cardinals were a bad team that got lucky in the playoffs, but it could just as well mean that the Cardinals were a good team that got unlucky in the regular season. After all, the chances that a team that was truly as bad as the Cardinals' record beating 3 teams that were truly as good as the Padres', Mets', and Tigers' records in the playoffs are the same as a team that is truly as good as a 94-95 win team performing as poorly as the Cardinals did over the regular season.
Continue Reading...

Christy Mathewson painting

I finished a new baseball painting today; this one of Christy Mathewson. It was a gift for my dad (who occasionally contributes to 3-DBaseball), and will be hanging in one of his baseball rooms soon. Note that Mathewson does remarkably in BSAB (BrushStrokes Above Background) here.

Image in the full article.

Christy Mathewson

Click image for full-size (~700kb). Also, no, he isn't wearing a hat. He was warming up in the bullpen in my stock image, and, being the dashing man that he was, had not donned his hat. I liked it that way, so he's not wearing one here either.
Continue Reading...

FIP Constants (ERA-scale vs. RA-scale)

One of the long-standing debates in statistical circles of the game is whether ERA or RA should be used for pitchers. In the wake of the DIPS-wave that hit the analytical world, the residual of this debate is the question of which scale should be used for metrics that don't directly measure observed runs or earned runs allowed. This new question has nothing really to do with the actual ERA vs. RA debate, as it's purely a matter of scale and not of what we should or shouldn't measure (as is the original debate), but it remains a point of contention. Which is more important: the familiarity of the ERA scale and the readiness with which casual fans can make comparisons to their old standby (most fans will almost always compare DIPS stats to ERA, not to RA, even if the DIPS stat is scaled to RA), or the intuitive nature and usability for more advanced applications of RA? On the one hand, we have the original DIPS, FIP, and now tRA at FanGraphs scaled to ERA, choosing the benefits of familiarity over intuitiveness. On the other hand, we have tRA outside of FanGraphs, as well as most analysts who use DIPS metrics to convert to value, using or converting to the scale of RA instead.

For the most part, I don't particularly care one way or the other, since scaling to ERA or RA is, for most practical purposes, the same thing. Divide or multiply by .92 (or lgERA/lgRA), and you can easily go from one to the other. If you're using the metrics for anything more complicated than, say, looking at them, this step is probably the simplest you'll encounter, so I have no problem with either standard, at least as far as practicality goes. The issue is just a matter of presentation and the implications that go with that.

However, there is a related question I am more interested in, specifically with regard to FIP. As discussed here last October, FIP comes from the linear weights values of 4 categories of events (HR, BB, SO, and BIP) and is scaled to the the league ERA by adding a constant to the calculation. Similarly, FIP could be scaled to RA instead by changing the constant. It shouldn't matter which scale we choose, since we can easily convert from one scale to the other with a simple calculation. Because of how FIP works, however, it does matter which scale we choose when deciding what constant to use in the calculation.

The problem arises from the fact that the linear weights used to calculate the coefficients in FIP are on the scale of runs, while ERA is on the scale of earned runs. Earned runs are a smaller scale than runs, by a magnitude of about .92. To see why this creates a problem, consider how FIP is calculated:

FIP = (13*HR + 3*BB -2*K)/IP + C
let
(13*HR + 3*BB -2*K)/IP = x
FIP = x + C

This is the basic construction of FIP; a value is calculated for each pitcher, and then a constant is added to this value to put FIP on a more usable scale. The end goal of this constant is to convert FIP to the scale of either ERA or RA. Which scale you choose should make no difference because, as mentioned earlier, ERA is just RA divided by .92 (or something close to that), and you should be able to convert one to the other with a simple calculation. That is not true in this case. Let's let the following two equations represent FIP scaled to ERA and to RA respectively:

erFIP = x + C1; C1 = lgERA - lgx
rFIP = x + C2; C2 = lgRA - lgx

x is the same in both equations. The only difference is the value of the constant. Now, let's convert rFIP to erFIP using our multiply-by-.92 rule:

erFIP = .92*(x + C2)
=.92*x + .92*C2

.92 times a constant is just another constant, so:

=.92*x + C3; C3 = .92*C2

Compare that to the original equation for FIP scaled to ERA:

erFIP1 = x + C1
erFIP2
=.92*x + C3

As long as we choose the correct values of C1 and C3, there shouldn't be a difference between these two values, but there is. To see why, subtract the two equations, assuming erFIP1=erFIP2:

erFIP1-erFIP2 = (x + C1) - (.92*x + C3)
0 = x-.92*x + C1-C3

Here, C1-C3 is another constant, because it is just the difference between two constant numbers:

0 = x*(1-.92) + C4; C4 = C1 - C3
0 = .08*x + C4

This can't be true for all values of x. When C4 is set to that this equation is true on average, it means that erFIP1 is smaller than erFIP2 when x is lower than average (meaning the difference between the two equations as shown above will be negative) and that erFIP1 is larger than erFIP2 when x is higher than average (the difference between the equations will be positive). In other words, FIP will be lower for good pitchers and higher for bad pitchers if you scale it directly to ERA than if you scale it to RA and then convert to ERA-scale. The spread between pitchers is larger for the former method than for the latter.

Another way to look at this is to consider FIP as two components: the measure of pitchers' results (x), and the constant (C). x is measured in runs. If C is set to scale to earned runs instead of runs, then x will make up a larger portion of FIP, and, since x is the part of FIP that varies from pitcher to pitcher, the variance of FIP between pitchers will be inflated relative to the scale of the metric.

To illustrate this point, consider the following graph, which is just a scatter plot showing erFIP1 and erFIP2 from the above formulae for every pitcher to throw at least 100 IP in a season since 1970, as well as the difference betwen erFIP1 and erFIP2. The graph is sorted from left to right by the difference between the two figures:


Notice that when erFIP1 is smaller than erFIP2 (that is, when using a constant that scales FIP to ERA returns too small a value for FIP, assuming that scaling to RA is correct), FIP is small, and that, without exception, that difference rises as FIP rises for a given value of C (notice that the graph is really just one pattern stacked on top of itself several times; this is just the same pattern being plotted for different values of C in different years).

It shouldn't be surprising that there FIP has some inaccuracies. It is, after all, a shortcut for the original DIPS calculations designed to be much more simple and easy to use with only a small cost in accuracy. The question is how much difference this problem makes. As seen in the above graph, the difference between calculating FIP on the scale of RA and then scaling back to ERA and calculating FIP directly to the scale of ERA is small for most pitchers, and in fact approaches 0 as you get closer to average. It is on the edges of the graph, where pitchers are far from average, where the differences start to grow.

For example, Pedro Martinez, circa 1999. His FIP, with the constant set to scale to ERA, was 1.51*. With the constant set to scale to RA, it was 1.96, which, scaled back to ERA-scale, is 1.79. Still excellent, obviously, but not as good as his traditional FIP suggests. That's a difference of .28 runs per 9 innings. Say we were to calculate a WAR value for Pedro that year, how much difference would that make? We can ignore park adjustments for this specific purpose, since all we care about is how the two methods of calculating FIP compare. The AL average RA in 1999 was 5.31. Using 1.51 as Pedro's FIP (and dividing by .92 to scale to RA), that gives Pedro a W% of .885. Using .380 as replacement level, that's good for 12.0 WAR over 213.1 IP. Using 1.96 as Pedro's FIP gives him a W% of .851, or 11.2 WAR. The difference here is .8 wins.

Since 1970, 12 pitchers have had differences between their WAR figures as calculated by these two methods at least that big:

Year Pitcher IP erFIP rFIP W%1 W%2 WAR1 WAR2 diff
1972 Steve Carlton 346.3 2.20 2.63 0.659 0.682 10.7 11.6 -0.9
1973 Bert Blyleven 325.0 2.38 2.86 0.670 0.694 10.5 11.4 -0.9
1979 J.R. Richard 292.3 2.25 2.74 0.679 0.705 9.7 10.6 -0.9
1984 Doc Gooden 218.0 1.80 2.29 0.725 0.761 8.4 9.2 -0.9
1985 Doc Gooden 276.7 2.15 2.62 0.679 0.706 9.2 10.0 -0.8
1978 Ron Guidry 273.7 2.22 2.69 0.687 0.714 9.3 10.2 -0.8
1971 Tom Seaver 286.3 2.13 2.57 0.670 0.695 9.2 10.0 -0.8
1999 Pedro Martinez 213.3 1.51 1.96 0.851 0.885 11.2 12.0 -0.8
1971 Vida Blue 312.0 2.19 2.61 0.662 0.685 9.8 10.6 -0.8
1986 Mike Scott 275.3 2.20 2.65 0.685 0.711 9.3 10.1 -0.8
1970 Bob Gibson 294.0 2.55 3.03 0.671 0.694 9.5 10.2 -0.8
1973 Nolan Ryan 326.0 2.57 3.05 0.646 0.667 9.6 10.4 -0.8


Similarly, poor pitchers have WARs that are too low when measured by traditional FIP, though not by as much, since they pitch far fewer innings than elite pitchers. Of the 5630 pitcher-seasons with at least 100 IP since 1970, the RMSD of WAR1 and WAR2 was .15, with an average IP of 175.

I've used language in this article that assumes that using the constant that scales to RA is the more correct choice, as the coefficients of FIP are based on a scale of runs rather than runs scored (this is also the method used in the original DIPS statistic), but I haven't gone through the full DIPS calculations to compare. For now, I think it's important to just look at how much difference there is between using different coefficients and whether there is enough difference that it could be worth switching scales. Since the formula would be virtually identical (the only difference would be that the constant would be different), I would prefer using the formula that scales to RA rather than ERA. If you prefer the ERA-scale, that adds a step of multiplying by .92 (technically lgERA/lgRA, which you might as well use since you have to calculate the constant anyway), but that's simple enough that I don't think it hurts simplicity or usability any. It's just standard fare for going from one scale to the other.


*The FIP I'm using here differs from FanGraphs' value. There are a few different formulae for FIP floating around; I am using BB-IBB+HBP for the BB term in FIP, and using different constants for the AL and NL, while FanGraphs uses BB+HBP for the BB term and a single constant for both leagues in each season. Also, while on the subject of FanGraphs, this article shouldn't be an issue for their WAR values, because FG uses the constant that scales to RA for win values.

Continue Reading...

Back-to-Back Inning-Ending Double Plays (with a catch)

Last night, I was watching Venezuela play Puerto Rico in the Caribbean Series on the MLB Network. Aside from watching former-Cardinal pitcher Jason Simontacchi dazzle for a few innings, the most remarkable quirk of the night was that two straight half-innings ended on double-plays to the outfield (the first of which--a trapped fly ball by the right-fielder that caught the runners not knowing if the ball would be/had been caught and led to a force-out at second followed by a tag-out at home--was particularly bizarre). Curious, I decided to see if this has ever happened in MLB.

As always, it's Retrosheet to the rescue. Turns out, it's happened twice this decade. The most recent was in the bottom of the third/top of the fourth in a 2007 game between Minnesota and Tampa Bay when Ty Wigginton and Jeff Cirillo each hit into fly-outs with the runner caught tagging at first. Oddly enough, that was also the night when Carlos Pena hit the catwalk in Tropicana Field in two straight ABs, in case you were wondering about that "Single to 2B (Pop Fly)" line for Pena in the bottom of the 10th that led to the winning run.

Before that, it happened in the 9th inning of a 2001 game between Bostons of past and present (in Atlanta, naturally) when both teams spent the last of their days' worth of PAs on such double plays.

But what about a game with back-to-back inning-ending outfield double plays, with one of them seeing both outs come on the infield? None of this fly-out/outfield assist crap. Anyone can do that (even Jeff Cirillo!). You have to go all the way back to 1956 to find a possible match for that. On July 6, Detroit got out of the bottom of the first with a typical, boring sac-fly-slash-9-3-6-double-play, but in the top of the second, the real magic happened. Maybe. Officially, Bill Tuttle grounded into a 9-4-3 double play. Yes, grounded into. Now, I'm a bit skeptical that this double play ever made it to the outfield, just because, well, a 9-4-3 ground out? A straight 9-3 ground out is rare enough without the detour through second. Hell, even just a 9-4 fielder's choice is damn near unheard of. Maybe there was an error in recording the data. Maybe there was a weird 5-infielder shift on, though that would make no sense for the defense to try with a 2-run lead in the top of the second and a runner on first. Or, maybe Bill Tuttle and Jack Phillips both fell down. Maybe they had money on the scoreboard cap-dance game and could not afford to let their eyes wander to that less important game going on below. After all, the money in those days wasn't so great that such a matter would have been trivial. Maybe nothing unusual happened, Tuttle crossed first safely and easily, and the ump just blew the call by 3 or 4 seconds. Whatever it was, that's the one entry in Retrosheet's PBP files that fits, at least officially, all the criteria for what happened last night.
Continue Reading...