As the weekend draws to a close, so to does our first taste of interleague play in the 2009 season. One of the hottest topics this side of steroids in the modern game, interleague play has strong proponents on both sides of the issue. One of, if not the, central claims of supporters is the large attendance spike reported by MLB for interleague games. In 2007, MLB claimed attendance rose over 13% historically in interleague games and over 15% in 2007. The fans want to see it, teams bring in more revenue, what's not to like?
For starters, there's MLB's deceptive attendance reporting. There are a number of issues here, so first let's start with the 2007 exclusive figures. MLB tries to make it appear that interest in interleague games is actually higher in 2007 than it has been historically. One of the points of opposition to interleague play is that it has grown stale, and the initial excitement fans showed has waned over the years. MLB is indicating here that that is not the case. The problem with that is, the season was not over when they released these figures, and so the half-season figure from 2007 was not comparable to the historical number they were comparing it too. Most of those interleague games were from June, whereas the non-interleague games were more heavily weighted with April and May games, where attendance is always significantly lower. Once the non-interleague sample picked up more summer games, the non-interleague game attendance also rose. By the season's end, that 15.4% rise in attendance in interleague games was halved to a 7.6% increase, clearly much lower than their historical rise. Other recent years all show smaller increases than the early years of interleague play. However, MLB still has their skewed midseason figures posted almost 2 years later with no mention that the figure they reported for the year at the time is not even close to accurate for the year as a whole.
That is just one of many issues with MLB's reports, however. The historical attendance figures reported by MLB are also rife with further deception. For one, most (2 out of every 3) interleague games are played on weekends (Friday through Sunday), while most non-interleague games are played on weekdays. Attendance just happens to be about 19% higher on weekends than on weekdays. The figures MLB reports assume that the only factor that affects attendance is whether the game is interleague or not. This clearly isn't the case. A game's attendance is affected by a number of other factors, including:
-where the game is being played (a game in Yankee Stadium will have a higher attendance than one at PNC Park no matter who is playing)
-the day of the week
-the month
-whether the game is a day or night game
Of course, you could ignore these other factors if they could be expected to even out over a long enough period of time, which is generally what we do with stats when we want to measure one thing. The problem here is that none of these other factors do even out over time. MLB deliberately schedules interleague games when attendance is already likely to be higher.
For another example of the above issues not evening out, consider that because of the different number of teams in each league, AL teams have more interleague games in their parks, and NL Central teams have fewer than even other NL teams. So while the Yankees had hosted 106 interleague games through 2008, the Pirates had only hosted 86.
Something is very clearly wrong with the simplistic figures MLB gives us. None of the factors listed above that all influence attendance are accounted for in their attempt to isolate the effect of interleague play on attendance. Since MLB is not interested in giving us an accurate assessment of the effect of interleague play on attendance, we'll have to take our own look. For that, we turn, as always, to Retrosheet, where we can use gamelogs to isolate the effect of interleague play on attendance. To do this, we look at games that happened in the same park, in the same month, on the same day of the week, and either at day or night, and we compare the attendance only based on whether the game was interleague or not. So an interleague game played on a Friday night in Busch Stadium III in June is compared only to non-interleague games that also happened on a Friday night in Busch Stadium III in June. And so on for every interleague game from 1997 to 2008.
We find that attendance did rise, but only 5.9%, much less than MLB reports. We also find that the spike was higher in the early years of interleague play: in the last 5 years, attendance rose only 3.6%. So attendance does rise a bit in interleague games. Just not nearly as much as MLB tells us it does. We also can't say for certain, as we are often told, that this is a sign of greater fan interest.
Often times, the increase in attendance comes from fans of the road team that travel to support the team on the road. For example, Cardinal fans travel in hordes across the state to Kauffman and often return with stories of more red in the stadium than blue. Cub fans can easily follow their team to the new Comiskey. Does this mean they are more interested in the Cardinals playing the Royals than the Dodgers or the Cubs playing the Sox than the Mets? Not necessarily. There are plenty of reasons a Cardinal fan would go to Kansas City and not L.A. for a game, or a Cub fan would go to Comiskey but not Citi Field that have nothing to do with his or her level of interest in each game, namely that it's just easier and more realistic to get there. We can say for certain that interleague's attendance increases bring more revenue to teams (which is the other part of the argument). We can't really gauge fan interest, however, especially from such a modest spike.
Once we get past MLB's skewed presentation of the results, we can see that the majority of the increase in attendance in interleague games has absolutely nothing to do with them being interleague. What has essentially happened is that Bud Selig has observed that attendance naturally increases on certain dates throughout the year and always has, and he has somehow found a way to take credit for that. Or at least that's the way he's presenting it by so deceptively inflating the impact of his brainchild.
Continue Reading...
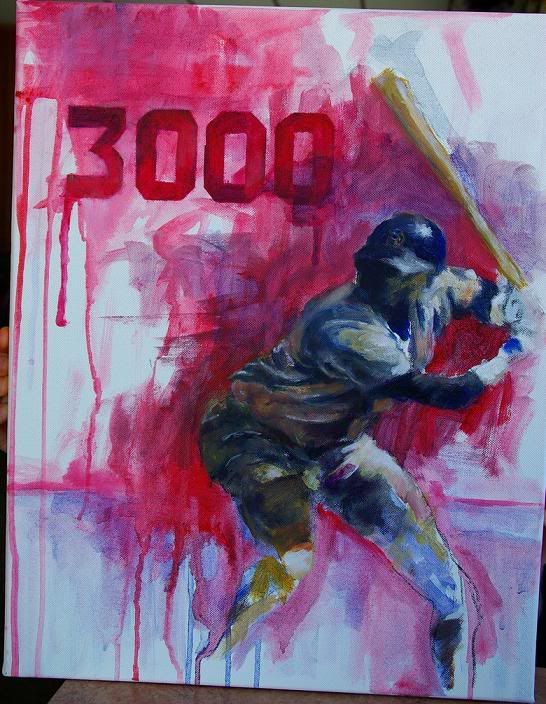
The Art of Hitting: Tony Gwynn
Today, the Padres dealt Jody Gerut in the most meager of salary dumps (why, again, did they pick up Brian Giles' option if they're going to keep doing stuff like this?) for a fringe Major Leaguer. Besides the move making no sense at all, the most interesting thing about the trade is the identity of the fringe Major Leaguer: Tony Gwynn, Jr. All you need to know about how much his dad still means to the team is that they told Sr. before anyone bothered to get a hold of him. When Tony, Sr.called his son to talk about it, he still had no idea. Anyway, this post doesn't really have anything to do with that. It's just a painting of Tony for those who want to appreciate the artistic side of the game rather than focus on the numbers like I usually do here. It is currently on loan to the Fire Chief of Osage Beach, MO, if anyone is interested in seeing it in person. Image in the full article.
Continue Reading...
Continue Reading...
A Lifetime of Asterisks: A Perspective on What to Do with Stats from the Steroids Era
Before the season and during the A-Rod steroid outing, my brother had suggested that the each of the three D’s of 3-D Baseball discuss his perspective on what should be done with the statistics of the Steroids Era. Of course, we never really got around to it. But in the wake of Manny’s high-profile suspension and Clemens’ groundhog-like resurfacing (if he saw the shadow from his third ear, does that mean another six weeks of steroid-related news?), I feel that it is, once more, an appropriate time to address this issue.
This whole discussion would be rendered moot beyond an individual suspension if this concerned any other sport. The reason why the impact is so great on statistics in baseball is that the numbers are what define the game. Only in baseball do arbitrary numbers like 61 and 755 represent something so vital and eternal. One of the worst things about steroids is that they are working to strip these numbers and those who achieved them of their vitality. Because of this, it is clear to me that those who use steroids have no respect for that which makes baseball so special, and something needs to be done with their statistics as a result.
Unfortunately, this may be the only thing regarding steroids that is absolutely clear. One muddy aspect about steroids and the Steroids Era is how it compares the distorted numbers of other eras throughout baseball history. It would be incredibly naïve to say that steroids have been the only external force to impact offensive statistics in baseball throughout the course of time, so why pay much regard to their impact without considering the effects of these other eras? For example, the Dead Ball Era of the 20th Century’s first two decades gave way to Lively Ball Era in the 20’s and 30’s, where the core of the ball and several bats were corked to inflate power numbers. The 70’s brought with it a lowered mound and the start of the designated hitter. Even today we’re seeing smaller ballparks and more hitter-friendly bats that may be contributing more to offensive spikes than steroids themselves.
Such external influences are inevitable in baseball, but steroids stand out from these era-defining traits because they demonstrate a conscious choice on the part of the individual. However, this issue becomes much cloudier once more when you consider the sadly deep history of cheating in the sport. From the shady tactics of early players like John McGraw and Ty Cobb to the sign stealing of the ’51 Giants to the spitballers and the corked bat users of the modern era, baseball is rife with individuals who have chosen to sully the good name of the game for personal gain. While these instances may not have defined their respective eras, there is no doubt that, at the very least, they impacted personal statistics to varying degrees.
The punishment for those caught either altering the baseball or corking their bats has been – much like those caught using steroids – a suspension and/or a fine. So why would we need to do anything with the statistics of steroid users when there is no such historical precedent with other instances of cheating? For starters, taking a steroid affects all aspects of a player’s game with only one use, whereas a pitcher putting Vaseline on a ball or a hitter using a corked bat only affects one play at a time. If a player is caught doing one of these, his statistics are essentially revoked for the plays in which they applied, so there is somewhat of a precedent for this on a diminutive scale. More importantly, though, citing that the baseball community didn’t do enough to alter statistics on past grievances is not solid grounds for saying that it should do nothing to address current problems. If we have a chance to preserve the integrity of today’s game and its future, then we shouldn’t let passive behaviors of the past influence that.
There’s also the issue that many of the players whose stats were affected by steroid use are guys that have never officially been linked to steroids and likely never will be. The faces of the Steroids Era – guys like Bonds, Clemens and McGwire – are probably never going to be proven to have taken steroids. They’re certainly not going to admit it themselves. This becomes very important when considering what should be done about what to do with stats during this period because these are the guys who have challenged and broken a number of the cherished records in baseball. If the goal is to preserve the integrity of baseball’s sacred numbers, what good would it do to alter stats when we don’t have any definitive proof that the suspected records were the product of steroids?
Clearly, this is a complicated problem with “yeah, buts” on practically every angle of the issue. Before beginning this essay, I was gung-ho about holding players in this era accountable by throwing out their stats in order to preserve the 61’s and the 755’s. And while I still hope to find a way to keep these numbers significant for my children, I realize that it may not be quite as easy as I had once hoped. We can’t take away a player’s numbers based on speculation. And thanks to Selig and the powers that be in baseball who never implemented the necessary testing and punitive measures at the beginning of this era, we may never have that proof.
One measure we can put in place that might help, however, is to remove individual stats from players who did test positive for steroids during the period in which they used. It would serve as a punitive measure to discourage players from using (or at least for testing positive), but such a tactic would obviously have its biggest impact on people who used in the past and are outed later. A-Rod, clearly, is the main example we have of this today, but he’s also a very sensitive case in that his admission, not a positive test, is why we know he used throughout his time with the Rangers.
Doing this would raise two justifiable concerns: it’s not fair to hold a player accountable based solely off of self-incrimination, and it would deter others from admitting their steroid use. Regarding the former, I realize that this reason would likely prohibit anything like this from ever happening, particularly when it concerns A-Rod’s stats. However, I believe that A-Rod’s stats belong more to public records than they do his own private collection because they will soon be held as the standards for future generations. I’m not saying he should go to jail for this – that would infringe on his individual rights. Because the significance of his numbers is public domain, however, I feel that this becomes a non-issue when discussing the fate of his stats. By admitting his past use, A-Rod was bold enough to accept the consequences of his actions. This, I believe, should be one of those consequences.
Regarding the latter concern, I’m not really all that interested in hearing any more posthumous admissions of steroid use from athletes, so I’m not terribly concerned if they stop doing it. I’m a little sick of seeing special pieces on ESPN of heavy steroid users who are burdened by their guilt fifteen years after the fact and try to redeem themselves with a public confession. Until we get a confession from an active player – which will never happen – these confessions won’t have any impact on the current climate of the game. Besides, it’s not as if Bonds or McGwire are going to admit to anything, especially since perjury is now involved.
The simple fact of the matter is that unless new information surfaces that links the players from this era that have eclipsed the game’s sacred numbers to steroids, the solution I’ve presented won’t really mean anything. And while I used A-Rod as an example, I’m not attempting to use this essay and the solution I discussed as an attack on him. While I don’t feel ashamed at the anger I’ve felt against him for finding out about his steroid use, I acknowledge the fact that the way in which we were presented this information was egregiously unfair, and it probably never should have happened. But like A-Rod said, baseball is much bigger than Alex Rodriguez, and as the news about Manny has proven, the steroids issue itself is beyond the focus of one individual.
Sadly, we may never have an effective way of resolving our anger as fans toward the guilty parties, and we may just have to endure a lifetime of asterisks.
Continue Reading...
Sonnanstine's Strange Day
Every so often, we see something rather peculiar happen in the sporting world. For instance, NASCAR held its All Star race this weekend, which, as far as I can tell, provides fans with their only opportunity to see the sport's biggest stars all competing on the same track for a whole week. But that's planned idiocy. Yesterday, we saw an even better kind. Due to a lineup card mistake, Rays pitcher Andy Sonnanstine replaced DH Evan Longoria in the 3rd spot in the batting order, and, in doing so, became only the 4th pithcer, along with Fergie Jenkins, Ken Holtzman, and Ken "George" Brett, to crack the starting batting order as a pitcher in the post-1973 American League. Sonnanstine's game was rare beyond even that small class, however.
All three of the other pitchers who batted in the DH-era AL were from the early years of the rule (all were in 1976 or earlier). They were all used to batting most of their careers to that point: Holtzman played 6 years for the Cubs and 1 year for Oakland pre-DH before he was penciled in to hit for himself, Jenkins was fresh off an 8-year stretch with the Cubs, and Brett played his first 4 years in the pre-DH AL before switching leagues in 1973 for the next 3 years. Holtzman and Brett were used to PH in their careers, and Brett, who is the only pitcher to bat for himself in the starting lineup twice in the DH-league, PH 28 times over his career, including 6 times in the 2 and a half months between his two occurrences. These three pitchers averaged 546 career PAs prior to hitting for themselves. Sonnanstine, on the other hand, had accumulated 14 career PAs hitting only in interleague games played in NL parks. Never before has such an inexperienced hitting pitcher been used in lieu of a DH.
Sonnanstine was also the only one of these to hit higher than 8th (which Brett did in one of his 2 games). In fact, he's the only pitcher dating back to the mid-50s, where Retrosheet has complete batting order data, to hit 3rd in the starting lineup, and in all of Retrosheet's batting order data, which includes data from a handful of years before the 50s, the only other pitcher to hit 3rd since the turn of the century was Babe Ruth for the Yankees in 1921. A number of pitchers did it in the 1800s, most notably all-around superstar Al Spalding (who, as a side note, left the game in his prime to found a sporting goods business).
Retrosheet's batting order data shows only 20 pitchers since the turn of the century (again, this is mostly 1950s on) who have even hit higher than 8th in the starting lineup. Mickey McDermott did it the most: 10 times in the available data, and probably more considering this instances were mostly right at the beginning of where the data becomes available. These 20 pitchers combined for 50 games where they hit higher than 8th. In 42 of these, the pitcher hit 7th. Of the other 8:
-Three were by Jimmy Lindell, and career outfielder who, at age 36, briefly revived his career in 1953, 3 years after he last played in the Majors, as a pitcher.
-One was by Cesar Tovar, the Twins leadoff hitter who played anywhere and everywhere on the diamond, in a publicity maneuver where he played every position in the same game. It was the only Major League game he ever pitched.
-One was by Jack Bentley, a pitcher the Phillies converted to first base in 1926. He also started 3 games on the mound that year, and in one, he hit in his normal 5th spot.
-One was by Alvin Dark, the Giants shortstop who regularly hit 2nd and occasionally led off. He pitched a game in 1953 and led off.
-The only game by a regular pitcher was from Gary Peters in 1968, when he hit 6th in the first game of a double-header against the Yankees on May 26. It was the only game Peters ever started in which he didn't hit 9th, but he was known as a decent hitting pitcher: he PH 75 times in his career, including once in the second game of that doubleheader.
-The other game was Babe Ruth's, whose, along with Dark's and Tovar's, fills out the group of games in the Retrosheet data where the starting pitcher has hit in the top 4 spots.
So Sonnanstine's only real match here is Gary Peters, if we're willing to count hitting anywhere 6th or better as close enough to hitting 3rd.
Beyond just being put in a strange position, Sonnanstine further distinguished himself by actually succeeding, going 1 for 3 with an RBI double. Of the other pitchers to bat in the starting lineup in the DH-era AL, only Fergie Jenkins got a hit. Of any pitcher to bat at any point in a DH game, only Eduardo Rodriguez (Game 1, Sept. 3, 1973), Mike Jeffcoat (Aug. 2, 1991), John Wetteland (Aug. 16, 1997), and David Howard, who was a shortstop but pitched a game in relief and came to bat as a pitcher (Apr. 12, 1994), have hit for extra bases. Jeffcoat, Wetteland, and Howard are joined by Mike Benjamin, another shortstop who pitched a game in relief and batted as a pitcher (June 21, 1997), and Buck Martinez, a catcher who did the same (Aug. 29, 1979), as the only other pitchers to knock in a run in a DH game. So only 3 other real pitchers have hit for extra bases in a DH game, and only 2 other real pitchers have tallied RBIs.
Quite the strange day for Mr. Sonnanstine. Even with all this, though, the strangest part might actually be the following:
Sonnanstine's night bumped his career line up to.385/.467/.462, which is actually better than Evan Longoria's.
Maybe it wasn't a mistake.
Continue Reading...
A Note About Park Factors
The year was 1996. Baseball was riding high again after the ugly strike that had brought the game screeching to a halt just a short year and a half earlier. Cal Ripken had broken Lou Gehrig's long-standing record the year before. Mark McGwire was just starting to belt home runs like no one had ever seen (he missed 32 games that year and still managed to top 50 for the first time in his career), and no one had yet figured out why. Most importantly for a 10 year-old Cardinal fan, an aging Wizard was making his last rounds before bowing out of the game, and he was doing it for a playoff contender at that. This was the setting in which I hit the road with 3 of my closest relatives in the brotherhood of baseball, 2 generations of biological brothers on the road from St. Louis to Cincinnati, and then onward throughout the northeastern quadrant of the country wherever there was baseball.
We saw the Monster of Fenway, the obtuse angles of the outfield wall, the Pesky pole. We saw the ivy of Wrigley, the bleachers, the crowds on Waveland Avenue. The canopies of old Tiger Stadium. The friezes in Yankee Stadium, the grandstands of Doubleday Field. The visible seams in the turf at the SkyDome. We mercifully skipped over Shea. My brother, a year older but just as wide-eyed, and I learned why they were called cathedrals. My dad and uncle saw for the first time their temples of Mecca jump out from staticky TV sets into tangible form beneath their feet.
Younger still, I learned something about the field of play that sets baseball apart. For 127 feet, 3⅜ inches from home plate, in a 90 foot square, everything identical. It's meticulously laid out in the rule book with no room for error. Even the baseball itself is more loosely regulated than the diamond within these dimensions. But beyond that, you can do whatever the hell you want. Like my first Little League field, which had no outfield fence but some tricky playground equipment to navigate in play in left field. Anything that rolled into the woods in right or across the street past the playground and into the neighbor's farm was assumed to be a home run simply because no one wanted to chase a ball that far. Seeing in person the lots these players roamed as we traveled across the country awakened me to a greater truth of baseball: we weren't just too poor for a real field. We were partaking in one of baseball's grand traditions.
All this is to say that baseball exhibits a wide variety of contexts, much more so than other mainstream sports in this country. To a statistician like myself, this can present some problems. What a hitter does in Coors is not the same as what a hitter who puts up the same numbers in Petco does. For this reason, park factors are one of the most important adjustments we have to make to raw statistics, to the point that any advanced metric that wishes to be taken seriously must include them.
Fortunately, there are places that keep track of basic park factors, and these can be very useful as long as you know how to use them. For example, you may want to know how Matt Holliday's success in Coors would translate into Oakland's park. Or how Adrian Gonzalez would hit had he not screwed up his karma and found himself banished to the caverns of Petco. The problem is, it is not always entirely clear how to use these factors to adjust stats.
One place to find simple park factors is on ESPN.com. They list the park factors for a number of basic statistics along with the formula they use:
PF = ((homeRS + homeRA)/(homeG)) / ((roadRS + roadRA)/(roadG))
This is the basic idea behind all park factors: compare what happens in a team's park to what happens in every other park. You can use this formula (replacing runs scored with whatever stat you want to look at, of course) to calculate your own park factor for any statistic you would like.
So how do you use these park factors? Say, you want to know what factor of 1.12 means. Basically, that means that the stat you are looking at is increased by a factor of 1.12 in that park compared to other parks in the league. So if a player hits 40 home runs in a park with a home run factor of 1.12, you would estimate that he likely got 12% boost in the home runs he hit at home, and if he played in a neutral park, he probably would have hit fewer. To account for an increase of 12%, you would divide the total by 1.12.
However, you have to also keep in mind that this type of park factor only tells you about the boost a player gets at home. He also plays half his games on the road, which we assume is a roughly neutral environment, on the whole. So if a hitter plays half his games in a 1.12 environment and the other half in a 1.00 (which would be perfectly neutral) environment, then we would want to average these to find the effect on his overall numbers. Which means the hitter played in an overall environment that increased his totals by 6 percent rather than the 12 percent shown in the park factor.
So with ESPN's park factors, or with any you might calculate using the same formula, you have to be careful in applying them to a player's season numbers because the PF only accounts for what he does in his home games. You have to average this with a neutral environment to account for the fact that he plays half his games on the road.
Another site that publishes park factors, and one of the best sites for baseball statistics in general, is Baseball-Reference. On every team page, there are a few different park factors listed. Unlike ESPN, they only list run scoring park factors, but also unlike ESPN, they adjust for a number of problems with the simple formula shown above.
As you will quickly notice, there are both one-year and multi-year park factors. One problem with these calculations is that they rely on observational data which can be prone to random fluctuation to estimate the effect of the park. Which isn't really a problem; in fact, it's more or less what all statistics are. But, like with all statistics, having more data to look at improves the accuracy, and by looking at 3 years of data instead of 1, you can get a better park factor. Which B-R does and ESPN doesn't. So that's one difference. Another improvement B-R makes is that it looks at runs per 27 outs rather than runs per game. If a team plays a number of extra inning games on the road, or has a number of games at home where they don't play the bottom half of the 9th, the number of innings played on the road or at home can vary enough to throw off your park factor by a small amount. Using outs (or innings) in the denominator instead of games accounts for this: an out or an inning is a fixed unit of length in baseball. A game is not. A third improvement takes into account that the road environment is not always neutral. 1.00 is a neutral park based on the league average. However, if an NL park has a factor of 1.12, then the other 15 parks will average to a bit less than 1.00, because adding in the 1.12 from the 16th park will bring the average up to 1.00. Instead of averaging 1.12 with a road environment of 1.00, you might have to average it with a road environment of .99. It's a small difference, but for extreme parks, it can matter.
Basically, these are all improvements on the previous type of park factor. So far, there is nothing that would cause you to use the park factor any differently. However, B-R makes two further adjustments that do make a difference in how you use them, or rather, one adjustment that changes how you use them and another you need to be aware of, because it is doing something completely different. The first is that it already averages the home and road environments of a team. So there is no need to cut the PF in half like with ESPN's. This is one reason that the PFs listed on B-R are generally smaller than on ESPN. So when you see a park factor of 112, you would actually divide the season numbers by 1.12, not 1.06.
The other adjustment has nothing to do with the park, but rather another component of team context. The quality of pitching a hitter faces is not the same as the quality of the league's pitching as a whole, because the league as a whole includes the hitters teammates, while the group of pitchers he faces does not. So if a hitter is on a team with a very good pitching staff, his numbers get a slight boost from not having to face those good pitchers. B-R's park factors account for this, which is slightly misleading, because it has nothing to do with the park. But it is another important adjustment to make, and since it's used the same way, lumping it with the park factor makes sense. This is also why there are separate PFs for hitters and pitchers. The effect of the park is the same, but accounting for the quality of hitters the pitchers face and accounting for the quality of pitchers the hitters face produce different results.
You can also calculate this type of park factor for any statistic you like, but it is much more complicated. The methodology is outlined in more detail on B-R's site.
To give an example, I calculated an ISO park factor for the Ballpark at Arlington from the years 2001-2003. The final park factor was 1.04, meaning Rangers hitters in those years saw a 4% increase in ISO from playing for the Rangers. The park factor, using the simple method above, was 1.13. The adjustments for improving that park factor give a more accurate figure of 1.12. This number would be used the same way as the ESPN park factors: average it with a neutral context and then divide the player's ISO by the final figure. Using B-R's methodology, we do this anyway, and end up with a park factor of 1.06. That is the effect of the park. However, we also further account for the fact that Texas' pitchers sucked, and that the Rangers had the poor fortune of not getting to face these pitchers. That adjustment knocks 2% off their ISO, so we drop our final number down to 1.04. So the adjustments to the numbers would go as follows:
due to park: divide by 1.06
due to quality of pitchers faced: divide by .98
combined effect of both: divide by 1.04
Basically, the most important things to keep in mind when dealing with park factors:
-you divide the stat by the park factor to neutralize the context
-with ESPN's PFs, or others calculated similarly, you first have to halve the park factor and then divide
-with B-R's PFs, or others calculated similarly, you simply divide by the number they give you
-B-R's PFs are more accurate than ESPN's, but only provide PFs for run scoring and not other stats
This is far from everything there is to know about park factors, but it should give you an idea of what they are, and how to use them.
Continue Reading...